
Author: Paul Russell
Title: Hospitality Industry
Area:
Country: United States
Program:
Available for Download: Yes
View More Student Publications Click here
Sharing knowledge is a vital component in the growth and advancement of our society in a sustainable and responsible way. Through Open Access, AIU and other leading institutions through out the world are tearing down the barriers to access and use research literature. Our organization is interested in the dissemination of advances in scientific research fundamental to the proper operation of a modern society, in terms of community awareness, empowerment, health and wellness, sustainable development, economic advancement, and optimal functioning of health, education and other vital services. AIU’s mission and vision is consistent with the vision expressed in the Budapest Open Access Initiative and Berlin Declaration on Open Access to Knowledge in the Sciences and Humanities. Do you have something you would like to share, or just a question or comment for the author? If so we would be happy to hear from you, please use the contact form below.
For more information on the AIU's Open Access Initiative, click here.
My motivation for this report is driven by my passion for the Hospitality industry and its many facets. In producing this research report I had to rely on a lot of co-operation from many professionals within the industry and numerous tourism reports by the UAE government sectors.
Without the assistance of the numerous hospitality professionals that I have received the completion of this report for my Master’s Degree would not have been possible. I would also like to thank my wife who has to suffer my constant studying and complaining when I am struggling to compile information.
Table of Contents
Introduction
OVERVIEW OF DUBAI HOTEL PERFORMANCE
COMPETITIVE SET ANALYSIS
SUITE PERFORMANCE
APPENDIX: DUBAI HOTEL HISTORIC SUPPLY INDICATORS (2005)
APPENDIX: COMPETITIVE SET PERFORMANCE INDICATORS (2005)
APPENDIX: ROOM FEATURES
General Information
Tables
Table 1-0 New Hotel Guest Rooms Supply by Country (Rooms)
Table 1-1 Dubai Hotels Supply and Demand Summary (Q1 & Q2 2007)
Table 2-1 Competitive Set – Overview
Table 2-2 Competitive Set – Unit Types and Sizes
Table 2-3 Competitive Set – Unit Types Distribution
Table 2-4 Competitive Set – Key Performance Indicators (Jan-April 2007)
Table 2-5 Competitive Set – Key Performance Indicators (2006)
Table 2-6 Competitive Set BAR Comparison
Table 2-7 Competitive Set BAR Variance Analysis
Table 3-1 Competitive Set Suite Performance Summary (2007)
Table 4-1 Dubai Hotels Supply and Demand Summary (2006)
Figures
Figure 1-1 Five Star, Four Star and Other Hotel Room Occupancy (2000-2006)
Figure 1-2 Five Star, Four Star and Other Hotel Bed Occupancy (2000-2006)
Figure 1-3 Five Star, Four Star and Other Hotel ARRs (2000-2006)
Figure 1-4 Five Star, Four Star and Other Hotel RevPAR Indicators (2000-2006)
Figure 1-5 Luxury Hotel Revenues (2000-20006)
Figure 1-6 Five Star Hotel Revenue Indicators (2000-2006)
Figure 1-7 Four Star Hotel Revenue Indicators (2000-2006)
Figure 1-8 Total Revenues per Hotel (2000-2006)
Figure 2-1 Competitive Set – Occupancy Evolution 2005-2007
Figure 2-2 Competitive Set – Average Room Rate Evolution 2005-2007
Figure 2-3 Competitive Set – Seasonality 2006
Figure 4-1 Luxury Hotel Supply (2000-2006)
Figure 4-2 Luxury Hotel Room Supply (20002006)
Figure 4-3 Luxury Hotel Bed Supply (20002006)
Figure 5-1 Competitive Set ARR and OCC (2005)
Figure 5-2 Competitive Set-Select- Seasonality2005
Glossary of Terms
Abbreviation |
Description |
AED |
Dirham |
ARR |
Average Room Rate |
CAGR |
Compound Annual Growth Rate |
DTCM |
Dubai Department of Tourism and Commerce Marketing |
DXB |
Dubai |
F&B |
Food & Beverage |
GCC |
Gulf Co-operation Council |
M2 |
Square Meters |
MICE |
Meeting, Incentive, Conference and Exhibitions |
OCC |
Occupancy Levels |
RevPAR |
Revenue per available Room |
U.A.E |
United Arab Emirates |
USD |
United States Dollars |
Market Research Report On the Hospitality Industry In Dubai, UAE.
Introduction
Tourism in the UAE is the economies fastest growing area, and Dubai takes the lead as the fastest growing holiday destination in the history of the travel industry according to the WTO (World Tourism Organisation). Worldwide tourism growth remains at an average 3.7% for the rest of the world whilst the Middle East hit the 10.2% highs in 2006.
Dubai’s hotels also have one of the highest RevPar worldwide therefore attracting numerous hotel investors and developers eager to cash in on the lucrative market.
According to Arthur de Haast, Global CEO of Jones Lang Lesalle, the onslaught of hotel and related leisure projects in the Middle East region is justified by the expectations of sustained growth in demand.
With this as a backdrop the following report has been generated benchmarking key properties and indicators as an investment tool for potential investors in the hospitality industry in Dubai.
This Market Research report has been compiled using a variety of information using traditional research methodology and reports by the UAE tourism board and interviews with a variety of professionals, whom will remain nameless, from a variety of Hotels within the region.
The main function of this report is to provide investment information for any developer in the UAE whom wishes to invest in the Hospitality industry and especially the lucrative five star hotel market in Dubai
Although there is a general lack of transparency within the industry due to its increasingly competitive nature all information present is as accurate as I can possibly achieve and all supplementary methods have been utilized to check the accuracy of the figures.
1.1 The Hospitality Industry in the Middle East
Whilst the current growth in hotel supply in the Middle East is based on future targets of a promise land, the current results in the industry indicate that they are on the right track.
According to HVS’s international research approximately 253 new hotels will be coming on line over the next four years giving an additional 120,000 guest rooms. This is a pure addition to the current amount of rooms available and excludes the enormous Dubailand’s project. Dubailand (Bawadi) alone has a reported sixty thousand hotel room with one hotel ‘Asia Asia’ having a reported 6,000 guest rooms in one hotel (Arif Mubarak, CEO Bawadi).
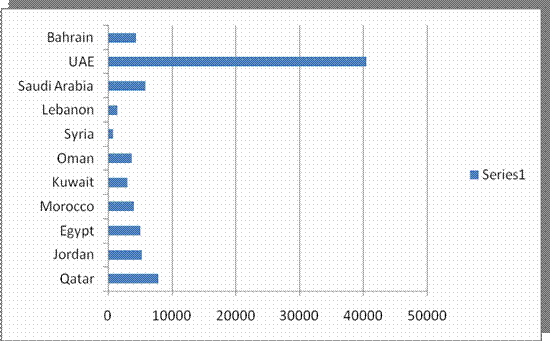
The vast quantity of these guest rooms are in the UAE, which accounts for almost 60% of all new supply. In Dubai alone the following quantity of guest rooms are reported to be entering the market (Chris Clarke 2008);
Figure 1-0 - New Guest Room Supply by Country (Rooms)
Years 2008-2009
Source: HVS International Research 2007
1.2 Construction Costs per Room
Construction costs in June 2007 were running at approx USD $500-600,000 per room for a high end five star project. With recent inflationary pressure caused by market forces costs in the construction industry have escalated, MEED (Middle East Economic Digest) estimate an average room cost of 1.5 million per room at May 2008. This is an increase tripling of construction costs in a one year period in the UAE.
The table below highlights the wide variation in constructions costs per room for a selection of recently announced projects where the costs and number of rooms were published.
These projects sit in a wide range from US$700,000 to US$20,000,000 and are for developments currently master planned with released figures.
Country /Emirate |
Project |
Price |
No. of Rooms |
Price. Per Room |
Bahrain |
Banyan Tree |
$170mil |
156 |
$1.08mil |
Jordan |
Ayla Oasis |
$1.4bil |
600 |
$2.33mil |
Oman |
Salalah |
$1.4bil |
700+ |
$2mil |
Saudi Arabia |
Red Sea T.P. |
$40bil |
557,000 |
$0.7mil |
Abu Dhabi |
Desert Island* |
$3bil |
150 |
$20mil |
Dubai |
Bawadi |
$54bil |
60,000 |
$0.9mil |
Fujairah |
Mina Al Fayer |
$163mil |
200 |
$0.81mil |
Ras Al Khaimah |
Bab Al Bahr |
$327mil |
290 |
$1.12mil |
*Includes for the entire Desert Island development (source: Global Futures & Foresight – Hotel outlook 2020)
1.3 Overcapacity and Resourcing
The sheer scale of the newly announced developments coupled with those already underway raises the issue of whether the region is facing the risk of overcapacity.
With occupancy levels running at over 80% as demonstrated in tables inside the report, and record revenues of US $329 per night in the first quarter of 2007 in Dubai it is easy to see the motivation to construct further properties in the region.
However, a number of external factors could serve to depress
demand - such as a possible recession in the US and Europe (currently happening), concerns over climate change bringing travel restrictions in Europe, security worries and pressure on business costs driving down travel budgets.
Whilst ‘Plan A’ is focused on an assumption of continued growth, the operators need to think clearly about ‘Plan B’ – e.g. what happens if they cannot attract the premium price customers at whom they are targeting the majority of developments? Would they be forced to lower prices and target a broader audience? If so, would they be able to retain the image of luxury and exclusivity so critical in attracting premium rate customers?
Another key challenge is whether the region will be able to attract and develop a sufficiently skilled pool of human resources to service these developments. With China and India’s economies on the rise, where will the human resource come from? WTTC had forecast the need for an additional 1.5million staff in the sector.
The WTTC estimate was created prior too many of the announcements for the large master planned projects. This being said I believe the WTTC estimate may not take full account of the scale and accelerated pace of development now being considered and the true figure could end up being closer to 2 - 2.5 million.
Failure to attract sufficiently qualified staff could lead to service failures which would have a detrimental impact on the brand image of those properties.
1.4 Rising Ecological and Environmental Concerns and the Growing Regional Response
Developers, operators and Local Authorities across the region are beginning to respond to the perception that travellers are becoming more concerned about the impact their vacations and visits are having on the environments they travel to.
Recent environmental issues raised in the region about waste, power, water and sustainability could have a potentially dramatic impact on the success of existing and recently announced hotel projects in the region hence the introduction of LEED accreditation in Dubai.
As travellers become more alert to these issues, they will seek ‘standards’ to rely on as guides to the most sustainable hotels to stay in – such as the Green Globe model – a ‘global
benchmarking, certification and improvement system for sustainable travel and tourism’ - endorsed by 182 Heads of State at the United Nations Rio de Janeiro Earth Summit in 1992.
An April 2007 Trip Advisor survey of over 1,000 travellers worldwide found 40% consider environmentally-friendly tourism when making travel plans. 66% say environment friendly measures in travel are making a difference.
Nearly 25% believe that air travel should be avoided, whenever possible, to help preserve the environment, while 38% said would pay more to take an eco-friendly flight and 26% would pay a 5-10% premium.
To stay at an environmentally-friendly hotel 34% said they would pay more money, while 38% said they had already stayed at an environmentally-friendly property, and 9% would specifically
seek out environmentally-friendly establishments.
When asked to specify how much they extra they would be prepared to pay for 'green' accommodation, 25% said they would pay a 5-10% premium, and 12% would pay a 10-20% premium.
Ian Rumgay, European communications manager for Tripadvisor says "This survey shows that far from being irresponsible, planet polluting energy wastrels that they are often portrayed, many
travellers do care about the environment and are willing to pay for it,". "It is a wake-up call for all sectors of the travel industry to provide more green options".
Increasingly broad assessments will be made of the ‘whole life environmental footprint’ of the sector – for example considering every aspect of a hotel’s construction, resource usage, waste and emissions. A number of encouraging developments are now underway suggesting the region is paying more attention to environmental concerns, for example:
• An eight million tonne capacity construction waste recycling plant has been launched by the Al Rostamani Group to help recover and recycle Dubai’s construction and demolition
waste. Costing around US$18M it will operate at full capacity by September. According to Dubai Municipality, 10.5 million tonnes of construction and demolition waste was handled in 2006 – representing 75% of Dubai’s total annual waste.
• Jordan’s Najwa Wadi Rum ecologically and socially conscious development is expected to reach Green Globe accreditation.
• The Fairmont Dubai has established a number of green initiatives in partnership with the Emirates Environment Group (EEG) – a UAE NGO focused on the environment.
• Masdar – a new 6sq km zero waste, zero carbon energy, science and technology community in Abu Dhabi will open in late 2009. While these and other similar developments are encouraging, significant environmental and resource challenges also exist.
• The UAE Minister of Environment has said that Arab cities will face a water shortage of 100 to 133 billion cubic meters per year by 2030 - presenting “the biggest economic, social and environmental challenge faced by Arab countries”.
• A survey by facilities management company Farnek Avireal found that Dubai's five star hotels consume up to 250% more water and 225% more energy than their European counterparts. Dubai’s Hotels average 650 to 1,250 litres of water per guest and
consume 2,750-3,250 KW of power per square foot. By comparison, hotels in Germany were said to be using 350 litres and 1,000 KW per square foot.
• Kuwait’s electricity and water minister has stated that it needs to spend $27 billion on water and power projects over the next eight years to meet growing demand
Market Research Thesis Repor
Investment Tool for Developers
Benchmarking Key Performing Five Star Properties
in Dubai UAE
Report Date May 2008
Author – Paul Russell
OVERVIEW OF DUBAI LUXURY HOTEL PERFORMANCE
2.1 Luxury Hotels Supply and Demand Summary (2007)
The following section provides an overview of luxury hotels in Dubai based on Q1 and Q2 2007 datasets provided by Dubai Department of Tourism and Commerce Marketing (DTCM).
A detailed historical perspective (years 2000-2006) of demand indicators for luxury hotels in Dubai are presented in the Sections 1.2 – 1.6 while historical supply indicators are provided in the Appendix.
Please note: For the purpose of this report, luxury hotels are defined as five star properties as classified by DTCM. Similarly, other hotels comprise four, three, two one star and listed hotels by DTCM classification.
Within the five star set I have specifically focused on the most up market sub-products such as suites and villas as these form a large part of the new five star product.
The following table presents a summary of supply and demand indicators for Dubai hotels in Q1 and Q2 2007:
Table1-1 Dubai Hotels Supply and Demand Summary |
|||
Category |
5-star |
4-star |
Overall All |
Supply Indicators |
|||
Operating Hotels |
42 |
49 |
317 |
Total Available Rooms |
12,377 |
7,384 |
32,032 |
Total Available Beds |
18,745 |
10,731 |
52,086 |
Demand Indicators |
|||
Room Occupancy Rate |
87.4% |
84.3% |
83.6% |
Bed Occupancy Rate |
89.2% |
83.1% |
80.9% |
ARR (AED) |
1,224 |
554 |
718 |
ARR (USD) |
335 |
152 |
197 |
RevPAR(AED) |
1,070 |
467 |
600 |
RevPAR (USD) |
293 |
128 |
164 |
Source: DTCM statistics, 2006
In 2007 luxury hotels comprised 13% of Dubai hotel supply (42 hotels). At 12,377 available rooms, luxury hotel rooms comprised 39% of total available rooms’ inventory at all hotels in Dubai.
Similarly in 2007, luxury hotels provided 37% of all available beds in Dubai hotels at an average of 1.51 beds per room. Four star hotels provided marginally less beds per room than five star hotels (1.45 beds per room).
Average room rates (ARRs) across all five star hotel products in Q1 and Q2 2007 stood at AED 1,224 (USD 335) per room compared to AED 554 (USD 152) per room for four star hotels and AED 718 (197 USD) per room for the overall market.
Five star hotels also enjoyed the highest room occupancy (87.4%) out of all categories of hotels (market average 83.6% occupancy for all hotels). As such, RevPARs at five star properties averaged AED 1,070 (USD 293) per available room compared to AED 600 (USD 160) per available room for the market.
2.2 Luxury Hotel Room Occupancy Indicators (2000-2006)
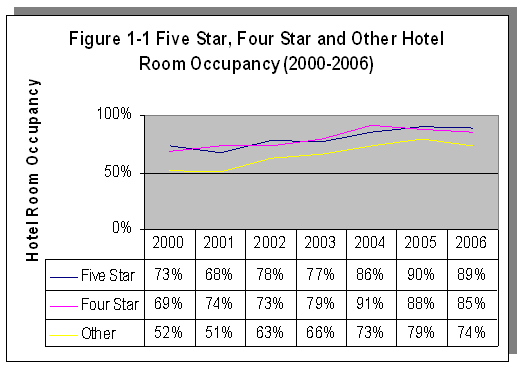
The figure below presents hotel room occupancy indicators for five, four and other hotels over the period 2000-2006:
Source: DTCM Statistics, 2006
Room occupancy at five star hotels outperformed all other categories averaging 80.0% between 2000 and 2006 while peaking at 90% in 2005. Four star hotels also achieved high room occupancies averaging 79.8% over the same period while outperforming five star hotel occupancies in 2004.
Since peaking at 91% room occupancy 2004 four star hotel room occupancy has declined to 85% in 2006 as 1,604 four star hotel room were added over this period (37% increase from 4,386 rooms in 2004).
2.3 Luxury Hotel Bed Occupancy Indicators (2000-2006)
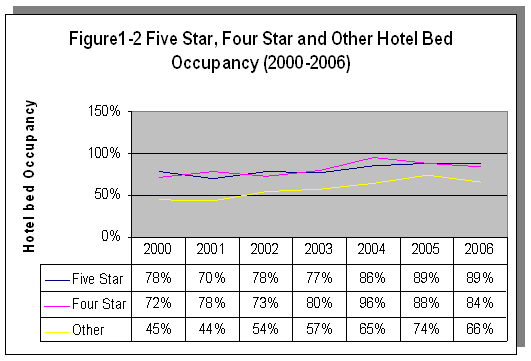
Figure 1-2 presents hotels bed occupancy indicators for five, four and other hotels over the period 2000-2006.
Source: DTCM Statistics, 2006
2.4 Luxury Hotel Average Room Rate Indicator (2000-2006)
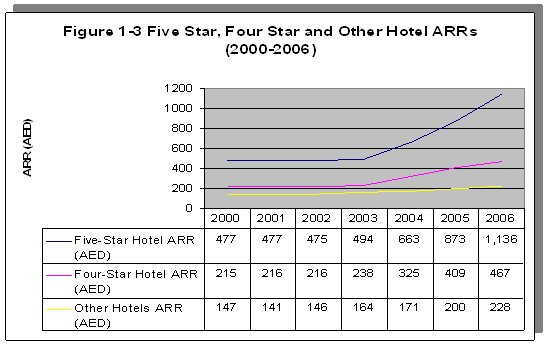
The figure below demonstrates Average Room Rate (ARR) evolution in Dubai hotels between 2000 and 2006 for luxury hotels. Growth in overall market ARRs has been driven predominantly by growth in ARRs for 4 and 5 hotels as the following figure presents:
Source: DTCM Statistics, 2006
Growth in ARRs for five star hotels at 138.1% exceeded growth in ARRs for four star hotels (116.7%) over the period 2000-2006. Comparatively, ARRs at other Dubai hotels only grew 55.3% over the same period.
Luxury Hotel RevPAR Indicators (2000-2006)
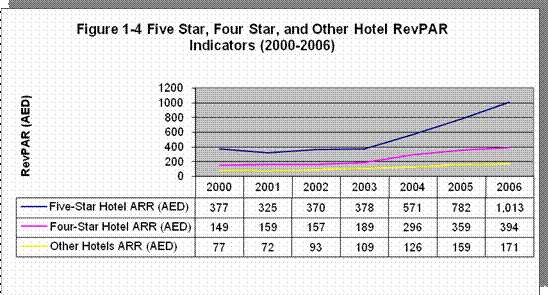
The figure below demonstrates Revenue Per Available Room (RevPAR) evolution in Dubai hotels between 2000 and 2006 for luxury hotels.
Source: DTCM Statistics, 2006
RevPARs for five star hotels have grown 191.7% from AED 347 per available room in 2000 to AED 1,013 per available room in 2006. RevPARs at four star hotels also exhibited strong growth increasing 164.6% from AED 149 per available room in 2000 to AED 394 per available room 2006. RevPARs for five star hotels were approximately two and a half times RevPARs for four star hotels in 2006. RevPAR for other hotels stood at an average of AED 171 per available room in 2006, less than half RevPARs for four star hotels.
2.6 Luxury Hotel Revenue Indicators (2000-2006)
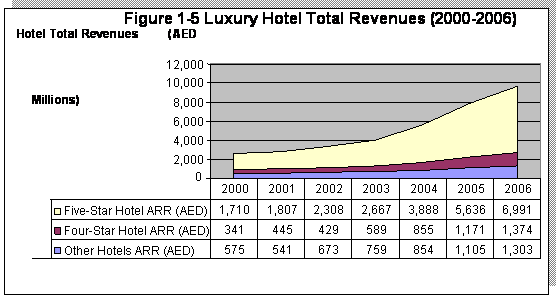
Figure 1-5 presents total revenues at luxury hotels in Dubai as proportion of total revenues earned at all hotels in Dubai over the period 2000-2006.
Source: DTCM Statistics, 2006
Note: Total Revenues are comprised of Room Revenues and Other Revenues as reported by DTCM.
Total revenues at five star hotels have increased 309% from 1.71 billion in 2000 to AED 6.99 billion in 2006. Comparatively, four star hotels achieved 14.2% of total 2006 hotel revenues while other hotels achieved 13.5%.
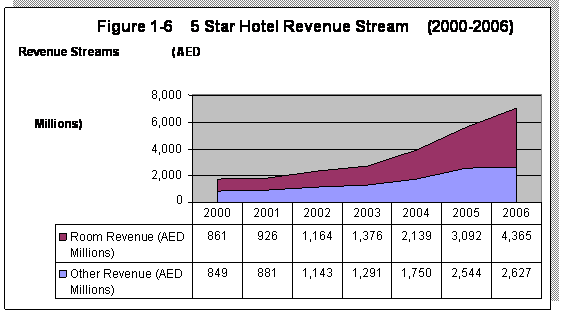
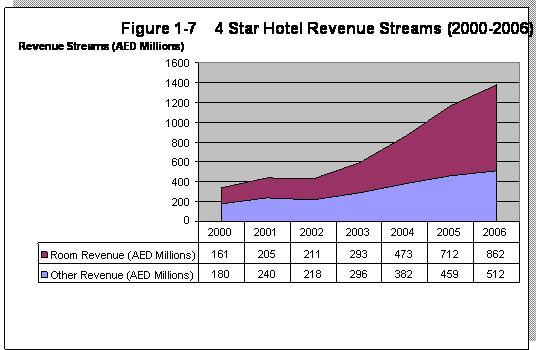
The following figures present a detailed breakdown of five and four star revenue streams and their evolution over time (2000-2006) at hotel category level and on a per hotel basis.
Source: DTCM Statistics, 2006
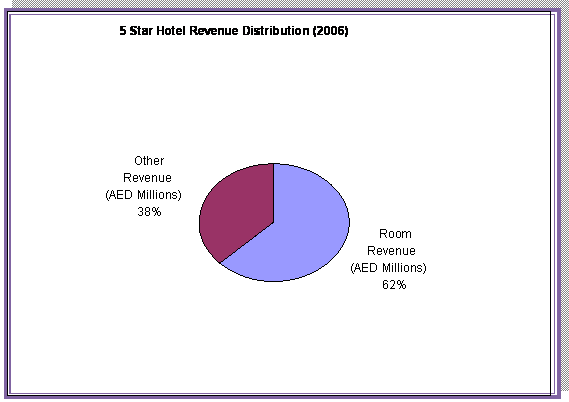
Room revenues at five star hotels grew 407.2% from AED 0.86 billion in 2000 to AED 4.37 billion in 2006. Comparatively, other revenues at five star hotels grew 209.4% over the same period to achieve a total of AED 2.63 billion in 2006.
While room revenues at five star hotels comprised 50% of total revenues in year 2000, proportionately room revenues have increased to 62% of total revenues in 2006.
Source: DTCM Statistics, 2006
Room revenues at four star hotels grew 436.6% between 2000 and 2006 from a total of AED 161 million to AED 862 million. In contrast, other revenues at four star hotels grew 183.8% from AED 180 million in 2000 to AED 512 million in 2006.
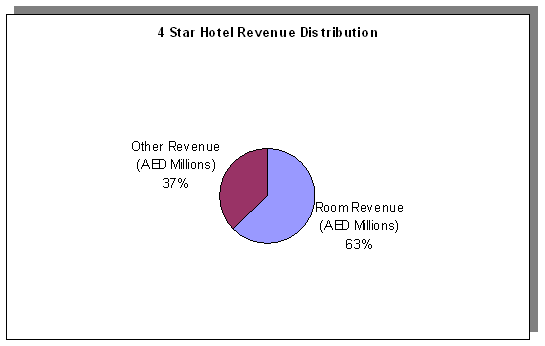
As with five star hotels, room revenues at four star hotels have increased as a proportion of total revenues between 2000 and 2006. Room revenues comprised 47.1% of total revenues at four star hotels in 2000, notwithstanding, room revenues grew as proportion of total revenues at four star hotels to 63% in 2006.
Source DTCM Statistic, 2006
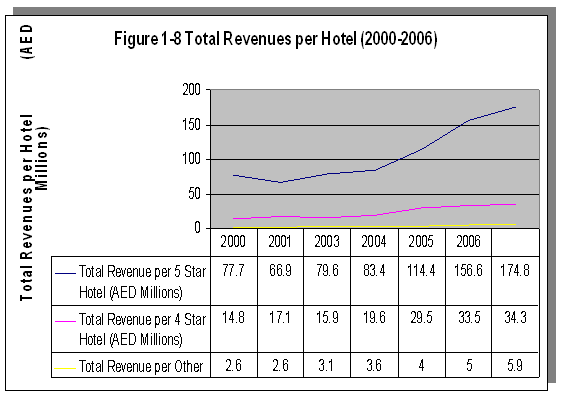
Revenues per hotel vary significantly between five star, four star and other hotel categories. In 2006, on average a five star hotel in Dubai earned AED 174.8 million in revenues while a four star hotel on average earned AED 34.3 million in revenues.
In comparison during 2006, the 222 other hotels in Dubai (three star, two star, one star and listed categories) on average achieved AED 5.9 million in revenues per hotel.
Total revenues per four star and five star hotel grew at similar rates; total revenues at four star hotel grew 131.7% from AED 14.8 million per hotel in 2000 to AED 34.3 million per hotel in 2006; total revenues at five star hotels grew 124.9% from AED 77.7% million per hotel in 2000 to AED 174.8 million per hotel in 2006.
COMPETITIVE SET ANALYSIS
The following section provides analysis of a select set of up market luxury hotels in Dubai. Five properties have been selected on the basis that they represent premium five star beach properties in Dubai and represent a similar product to the new developments that are up and coming in Dubai on the three new reclaimed Palm and Waterfront Developments.
These new developments have a considerable portion of their entire development strictly set aside for the five star resort leisure market.
3.1 Competitive Set Overview
A competitive set of five of Dubai’s leading hotels were selected on the basis of being competitive to the new developments on the main reclaimed masterplans.
I provided this market research to provide supply (facilities, location, room size) and demand (pricing, ARR, occupancy, market segmentation) indicators for new developers to allow them to understand the current market place and target their prospective market accordingly.
Out of the five hotels in this section, four are operated by the hotel operator Jumeirah, a subsidiary of Dubai Holdings.
The chosen hotels are all located within a 5 km stretch of beach in some of Dubai’s most prestigious communities such as Al Sofouh and Marsa Dubai communities.
The trunk of the Palm Jumeirah approximately bisects the strip of beach on which the competitive properties are located on.
All hotels within the competitive set provide outstanding architecture and service levels and an extensive range of luxury facilities and amenities; all have a fitness centres, business centre’s an executive lounge, recreation areas, spa facilities, and 24 hour room service.
A detailed description of the hotels, room amenities and details is provided in the Appendices. The following table presents on overview of the five properties that form the core competitive set.
Table 2-1 Competitive Set – Overview |
|||||
Property |
Hotel Name |
Total No.Units |
No. of F&B |
No. of Meeting |
|
Burj Al Arab |
|
202 |
8 |
5 |
|
Emirates Towers |
Emirates Towers |
400 |
15 |
18 |
|
Madinat |
Mina A’Salam Hotel |
292 |
8 |
2* |
|
Al Qasr |
292 |
9 |
0* |
||
Dar Al Masyaf |
283 |
2 |
0* |
||
|
The Palace |
246 |
4 |
1 |
|
|
Arabian Court |
172 |
3 |
5 |
|
|
Residence & Spa |
49 |
0 |
0 |
|
Ritz-Carlton Dubai |
Ritz-Carlton Dubai |
138 |
6 |
13 |
|
Jumeirah |
Ocean View |
598 |
22 |
14 |
|
Beit Al Bahar |
19 |
0 |
0 |
||
*Madinat Jumeirah has a separate conference centre with over 6,500 m2 of meeting space.
3.2 Competitive Set Room Mix and Sizes
The following table presents number of unit type as well as unit sizes for the competitive set:
Table 2-2 Competitive Set – Unit Types and Sizes |
|||||
Property Name |
Total No. of Units |
Unit Type |
No. of Units by Type |
Size (m2) |
|
Burj Al Arab |
202 |
Deluxe Suite |
142 |
170 |
|
Panoramic Suite |
18 |
225 |
|||
Club Suite |
4 |
330 |
|||
Two Bedroom Suite |
28 |
335 |
|||
Three Bedroom Suite |
6 |
670 |
|||
Presidential Suite |
2 |
667 |
|||
Royal Suite |
2 |
780 |
|||
|
|||||
Emirate Tower |
400 |
Double Deluxe Rooms |
200 |
44 |
|
Twin Deluxe Rooms |
48 |
44 |
|||
Double Tower Rooms |
40 |
44 |
|||
Chopard Ladies Rooms |
10 |
44 |
|||
Club Executive Rooms |
52 |
63 |
|||
Apex Suites |
31 |
87 |
|||
Summit Suites |
5 |
88 |
|||
Presidential Suites |
3 |
225-250 |
|||
Royal Suite |
1 |
312 |
|||
|
|||||
Madinat |
Mina |
292 |
Ocean Deluxe Rooms |
115 |
50 |
Arabian Deluxe Rooms |
81 |
50 |
|||
Club Ocean Deluxe Rooms |
31 |
50 |
|||
Premium Leisure Ocean Deluxe Rooms |
27 |
50 |
|||
Club Arabian Deluxe Rooms |
19 |
50 |
|||
Premium Leisure Arabian |
7 |
50 |
|||
Arabian Gulf Suites |
6 |
122 |
|||
Ocean Suites |
4 |
115 |
|||
Royal Suites |
2 |
268 |
|||
|
|||||
Madinat Jumeirah |
Al Qasr |
292 |
Arabian Deluxe Rooms |
99 |
55 |
Ocean Deluxe Rooms |
29 |
55 |
|||
Club Executive Arabian Deluxe Rooms |
40 |
55 |
|||
Club Executive Ocean Deluxe Room |
16 |
55 |
|||
Premium Leisure Arabian Deluxe Executive Rooms |
35 |
55 |
|||
Premium Leisure Ocean Deluxe Rooms |
41 |
55 |
|||
Junior Arabian Suites |
14 |
80 |
|||
Arabian Suites |
5 |
105 |
|||
Junior Ocean Suites |
3 |
82 |
|||
Property Name |
Total No. of Units |
Unit Type |
No. of Units by Type |
Size (m2) |
|
Madinat Jumeirah |
Al Qasr |
292 |
Ocean Suites |
7 |
105 |
Presidential Suites |
2 |
180 |
|||
Royal Suites |
1 |
550 |
|||
|
|||||
Dar Al Masyaf |
283 |
Arabian summer House |
108 |
60 |
|
Arabian summer House |
36 |
60 |
|||
Arabian summer House |
18 |
130 |
|||
Gulf Summer House |
47 |
60 |
|||
Gulf Summer House |
15 |
60 |
|||
Gulf Summer House |
3 |
120 |
|||
Gulf Summer House |
40 |
60 |
|||
Gulf Summer House |
8 |
60 |
|||
Gulf Summer House |
8 |
120 |
|||
|
|||||
One & |
The Palace |
246 |
Deluxe Room |
173 |
45 |
Gold Club room |
53 |
45 |
|||
Executive suite |
9 |
100 |
|||
Gold Club Suite |
9 |
100 |
|||
Royal Suite |
2 |
325 |
|||
|
|||||
Arabian Court |
172 |
Deluxe Room |
162 |
50 |
|
Executive Suite |
8 |
125 |
|||
Prince Suite |
2 |
145 |
|||
|
|||||
Residence |
49 |
Prestige Rooms |
32 |
58 |
|
Junior Suites |
12 |
85 |
|||
Executive Suites |
4 |
118 |
|||
Garden Villa |
1 |
300 |
|||
|
|||||
Ritz-Carlton Dubai Hotel |
138 |
Deluxe Room |
87 |
50 |
|
Club Room |
38 |
50 |
|||
Club Suite |
13 |
100 |
|||
Emirates Suites |
13 |
110 |
|||
Executive Suites |
13 |
100 |
|||
The Ritz Carlton Suite |
13 |
190 |
|||
Property Name |
Total No. of Units |
Unit Type |
No. of Units by Type |
Size (m2) |
|
Jumeirah |
Ocean View |
598 |
Ocean Deluxe |
247 |
50 |
Ocean Deluxe Balcony |
130 |
50 |
|||
Ocean club Executive |
99 |
50 |
|||
Ocean Premium Leisure Rooms |
74 |
50 |
|||
Junior Suite |
5 |
105 |
|||
1 Bedroom Suite |
3 |
128 |
|||
2Bedroom Suite |
21 |
162 |
|||
3Bedroom Suite |
5 |
215 |
|||
Beachcomber Suite |
6 |
148 |
|||
Presidential Suite |
1 |
216 |
|||
Royal Suite |
1 |
216 |
|||
|
|||||
Beit Al Bahar |
19 |
1 Bedroom Villa |
6 |
131 |
|
2 Bedroom Villa |
13 |
220 |
|||
The following table presents the unit mix for each competitive set based on number of rooms, club rooms, suites and villas offered by each property:
Table 2-3 competitive Set – Unit Types and Distribution |
|||||
Property Name |
Total No. of Units |
Unit Mix |
|||
Unit Type |
No. of Units by Type |
% Unit Distribution |
|||
Burj Al Arab |
202 |
Rooms |
0 |
0% |
|
Club Rooms |
0 |
0% |
|||
Suites |
202 |
100% |
|||
Villas / Villa Rooms |
0 |
0% |
|||
|
|||||
Emirates Towers |
400 |
Rooms |
298 |
75% |
|
Club Rooms |
52 |
13% |
|||
Suites |
40 |
10% |
|||
Villa / Villa Rooms |
0 |
0% |
|||
|
|||||
Madinat Jumeirah |
Mina |
292 |
Rooms |
230 |
|
Club Rooms |
50 |
|
|||
Suites |
12 |
|
|||
Villas/ Villa Rooms |
0 |
|
|||
|
|||||
Al Qasr |
292 |
Rooms |
204 |
70% |
|
Club Rooms |
56 |
19% |
|||
Suites |
32 |
11% |
|||
Villa / Villa Rooms |
0 |
0% |
|||
Table 2-3 competitive Set – Unit Types and Distribution |
|||||||
Property Name |
Total No. of Units |
Unit Mix |
|||||
Unit Type |
No. of Units by Type |
% Unit Distribution |
|||||
Madinat Jumeirah |
Dar Al Masyaf |
283 |
Rooms |
0 |
0% |
||
Club Rooms |
0 |
0% |
|||||
Suites |
0 |
0% |
|||||
Villas / Villa Rooms |
283 |
100% |
|||||
|
|||||||
One & Only Royal Mirage Dubai
One & Only Royal Mirage Dubai |
The Palace |
246 |
Rooms |
173 |
70% |
||
Club Rooms |
53 |
22% |
|||||
Suites |
20 |
8% |
|||||
Villas / Villa Rooms |
0 |
0% |
|||||
|
|||||||
Arabian Court |
172 |
Rooms |
162 |
94% |
|||
Club Rooms |
0 |
0% |
|||||
Suites |
10 |
6% |
|||||
Villas / Villa Rooms |
0 |
0% |
|||||
|
|||||||
Residence & Spa |
49 |
Rooms |
32 |
65% |
|||
Club Rooms |
0 |
0% |
|||||
Suites |
16 |
33% |
|||||
Villas / Villa Rooms |
1 |
2% |
|||||
|
|||||||
Ritz-Carlton Dubai Hotel |
138 |
Rooms |
87 |
63% |
|||
Club Rooms |
38 |
28% |
|||||
Suites |
13 |
9% |
|||||
Villas / Villa Rooms |
0 |
0% |
|||||
|
|||||||
Jumeirah Beach Hotel |
Ocean View |
598 |
Rooms |
451 |
75% |
||
Club Rooms |
99 |
17% |
|||||
Suites |
48 |
8% |
|||||
Villas / Villa Rooms |
0 |
0% |
|||||
|
|||||||
Beit Al Bahar |
19 |
Rooms |
0 |
0% |
|||
Club Rooms |
0 |
0% |
|||||
Suites |
0 |
0% |
|||||
Villas / Villa Rooms |
19 |
100% |
|||||
3.3 Competitive Set Key Performance Indicators
The following section provides summary key performance indicators for hotels within the competitive set. Key performance indicators are provided for the hotel as a whole. Additional detail (for year 2005) is provided in the Appendix. Table 2.4 presents key performance indicators for hotels in the competitive set for year 2007 (January through April):
Table 2-4 Competitive Set – Key Performance Indicators (Jan-April 2007) |
||||
Competitive Set |
Occupancy |
ARR (AED) |
YTD Room |
REVPAR (AED) |
One & Only |
95% |
1,873 |
84,101,469 |
1,786 |
Ritz Carlton |
89% |
1,721 |
21,360,993 |
1,533 |
Jumeirah Beach |
92% |
2,125 |
122,508,108 |
1,963 |
Mina Al Salam |
94% |
2,302 |
190,667,132 |
2,163 |
Al Qasr |
95% |
N.A. |
N.A. |
N.A. |
Dar Al Masyaf |
90% |
3,468 |
N.A. |
3,121 |
Burj Al Arab |
72% |
3,643 |
N.A. |
2,623 |
Highest average room rates during January – April were achieved by Burj Al Arab at AED 3,643 closely followed by Dar Al Masyaf (AED 3,468). Notwithstanding, highest occupancies (95%) were realized by One and Only Royal and Al Qasr over the same period.
For Comparison purposes, Table 2.4 presents key performance indicators for hotels in the competitive set for the full year 2006 (Source: Independent Research):
Table 2-4 Competitive Set – Key Performance Indicators (Jan-April 2007) |
||||
Competitive Set |
Occupancy |
ARR (AED) |
Room |
REVPAR (AED) |
One & Only |
86% |
1,460 |
212,616,538 |
1,257 |
Ritz Carlton |
81% |
1,219 |
49,538,134 |
989 |
Jumeirah Beach |
92% |
1,442 |
297,091,686 |
1,326 |
Mina Al Salam |
87% |
1,564 |
430,739,147 |
1,358 |
Al Qasr |
90% |
N.A. |
N.A. |
N.A. |
Dar Al Masyaf |
85% |
2,920 |
N.A. |
2,482 |
Burj Al Arab |
71% |
3,417 |
N.A. |
2,426 |
As in 2007, all suite in the Burj Al Arab achieved the highest ARR in 2006 at AED 3,417 while the highest occupancy was achieved by Jumeirah Beach Hotel. On average, ARRs within the competitive set have increased 31% between 2006 and 2007 while occupancies have increased by 5%. It should be noted however that the 2007 data provided is from the peak period of January to April.
3.4 Competitive Set Key Performance Indicators Evolution (2005-2007)
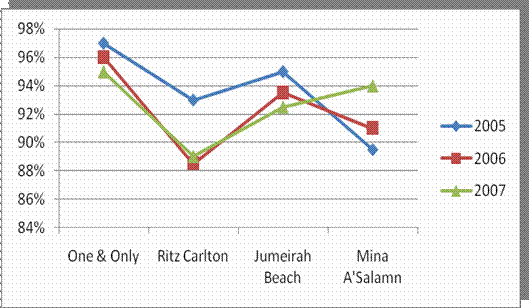
The following figures demonstrate the evolution of room occupancies and ARRs over the period 2005-2007 (Q1 and Q2. These figures are gained through independent research and knowledge gained through hotel senior staff:
Figure 2-1
Competitive Set – Occupancy Evolution 2005-2007
Source: Independent Research
With the exception of Mina A’Salam, occupancies at hotels within the competitive set peaked during 2005. In fact, Mina A’Salam is the only hotel within the competitive set that has increased year on year occupancy growth.
It should be noted, however, that all hotels within the competitive set experienced very high occupancies over 2005-2007 with the lowest occupancy being 88% realized by Ritz Carlton in 2006.
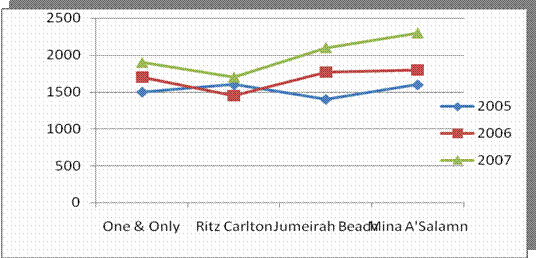
Figure 2-2
Competitive Set – Average Room Rate Evolution 2005-2007
Source: Independent Research
Average room rates within the competitive set have shown year on year growth with the exception of Ritz Carlton whose 2006 ARR declined marginally from 2005 levels.
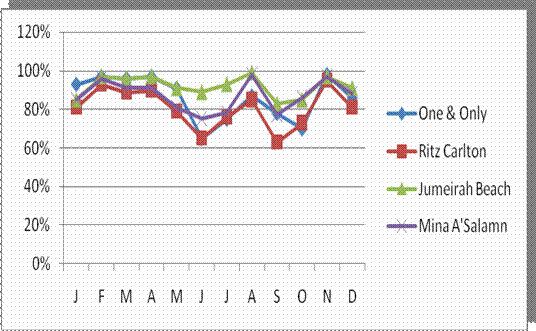
3.5 Competitive Set Seasonality Indicators (2006)
Figure 2-3 provides occupancies by month for year 2006 for competitive hotels. Hotels within the competitive set achieve high occupancies during November to April of a calendar year with occupancies declining through the summer. Notwithstanding, occupancies typically make a recovery in August before declining again in September. (Note: Ramadan took place on Sept 23rd up till the end of October in 2006).
Figure 2-3
Competitive Set – Seasonality 2006
Sources: Independent Research
3.6 Competitive Set Rate Comparison
This section provides a high level overview of best available rates (BAR) for rooms and suites within competitive set properties. Best available are provided for deluxe room, standard suite, and luxury suite products (or equivalent).
Please note: best available rates provided are internet rates for bookings through October-November 2007. The rates are listed in UAE Dirham (AED).
Table 2-6 |
|||
Competitive Set |
Low BAR Deluxe |
Middle BAR Suite |
Higher BAR Suite |
Burj Al Arab |
7,400 |
5,750 |
14,800 |
Ritz Carlton |
1,600 |
3,100 |
6,700 |
One & Only Royal Mirage |
1,900 |
4,520 |
13,010 |
Jumeirah Beach Hotel |
2,100 |
5,050 |
8,300 |
Mina’ A Salam |
1,950 |
2,550 |
5,900 |
Source: Independent Research; Hotel Websites
The average BAR rate for the deluxe room in AED 2c990, the average BAR rate for the 1st suite is AED 4,194, and the average BAR rate for the superior suite is AED 9,742.
Table 2-7 |
||
Competitive Set |
From Deluxe to the 1st Suite |
From the 1st standard to the Superior Suite |
Burj Al Arab |
10% |
45% |
Ritz Carlton |
90% |
55% |
One & Only Royal Mirage |
127% |
188% |
Jumeirah Beach Hotel |
74% |
80% |
Mina’ A Salam |
30% |
80% |
Source: Independent Research; Hotel Websites
The average variation between the deluxe room and the 1st suite is 66%, the average difference between the 1st suite and the superior suite is 90%.
The following table provides RAC, BAR and BB rates for Burj Al Arab.
Table 2-8 Burj Al Arab Rack Rate and |
|||
Burj Al Arab |
RAC (AED) |
BAR (AED) |
BB (AED) |
Deluxe |
7,500 |
5,000 |
7,400 |
Panoramic View Suite |
8,250 |
5,750 |
8,150 |
Deluxe Suite |
15,000 |
10,000 |
14,800 |
Source: Independent Research; Hotel Websites
At the Burj Al Arab, the difference between the RAC and BAR rates is minimum of AED 2,000. The difference between RAC and BAR rates are relatively consistent with RAC rates being 140-150% BAR rates. This could be attributed to the fact that Burj Al Arab is an all suite hotel.
Table 2-9 Mina Al Salam Rack Rate and |
||
Mina Al Salam |
RAC (AED) |
BAR (AED) |
Deluxe |
3,000 |
1,950 |
Executive |
3,900 |
2,550 |
Arabian Gulf Suite |
7,000 |
5,900 |
Source: Independent Research; Hotel Websites
For Mina A’Salam, the difference in RAC and BAR rates vary between AED 1,000 – AED 1,500.
Table 2-10 Ritz Carlton Rack Rate and |
|||
Burj Al Arab |
RAC (AED) |
BAR (AED) |
BB (AED) |
Deluxe |
7,500 |
5,000 |
7,400 |
Panoramic View Suite |
8,250 |
5,750 |
8,150 |
Deluxe Suite |
15,000 |
10,000 |
14,800 |
Source: Independent Research; Hotel Websites
The Ritz Carlton offers a price variation from AED 1,800 to AED 4,835 between RAC and BAR rates with the luxury suites exhibiting larger differences than rooms.
The Ritz Carlton does not have many suites to offer; therefore the hotel generally avoids upgrading guests to ensure uniformity of treatment.
Table 2-11 Jumeirah Beach Hotel Rack Rate and |
||
Jumeirah Beach Hotel |
RAC (AED) |
BAR (AED) |
Deluxe |
2,900 |
2,100 |
Club Executive |
3,800 |
3,000 |
Ocean Suite |
5,050 |
N.A. |
Beachcomber |
6,640 |
N.A. |
Villa |
9,100 |
8,300 |
Source: Independent Research; Hotel Websites
Jumeirah Beach Hotel maintains a steady AED 800 differences between RAC and BAR rates regardless of room type. This in effect represents a set discount.
Table 2-12 One & Only Rack Rate and |
||
Jumeirah Beach Hotel |
RAC (AED) |
BAR (AED) |
Deluxe |
2,210 |
1,900 |
Gold Club |
2,630 |
2,370 |
Gold Suite |
5,020 |
4,520 |
Royal Suite |
14,460 |
13,010 |
Source: Independent Research; Hotel Websites
Difference in pricing between RAC and BAR at the One & Only, varies from AED 310 to AED 1,450. Notwithstanding, in percentage terms BAR rates are at a 10% discount to RAC rates.
4.0 SUITE PERFORMANCE
Table 3-1 |
||||
Property Name |
Total No. of Suites / Villa Rooms |
ARR |
OCC |
|
Burj Al Arab |
202 |
3,643 |
72% |
|
|
||||
Madinat Jumeirah |
Mina A’Salam Hotel & Al Qasr |
44 |
3,000 |
70% |
|
||||
Dar Al Masyaf |
283 |
3,303 |
80% |
|
|
||||
One & Only Royal Mirage Dubai |
The Palace & Arabian Court |
30 |
2,400 |
75% |
|
||||
Residence & Spa |
17 |
3,200 |
75% |
|
|
||||
Ritz-Carlton Dubai Hotel |
13 |
2,500 |
75% |
|
Source: Independent Research (through Interview with Hotel Senior Management) *The single 2 bedroom villa at the One & Only Royal Mirage ‘Residence Spa’ achieves an average room rate of approximately AED 12,000 – 13,000.
Suites throughout the competitive set realized occupancies in the 70% - 80% range, performing approximately 15% points below the respective overall hotel occupancies. ARRs at suites ranged from AED 2,400 at the One & Only Royal Mirage ‘The Palace’ to AED 3,643 at the Burj Al Arab.
Additional information about demand trends for suites within the competitive set are provided below:
Suites at Ritz Carlton
Suites at Madinat Jumeirah: Mina Salam and Al Qasr
Suites at Madinat Jumeirah: Dar Al Masyaf
Suites at One & Only Royal Mirage
APPENDICES
APPENDIX: DUBAI HOTEL HISTORIC SUPPLY INDICATORS (2000-2006)
The following section provides a historical perspective (years 2000-2006) of Dubai hotel supply indicators. Preliminary supply indicators for year 2007 (Q1 and Q2) are presented in the main body of the report in Section 1.
Please note: For the purposed of this report. Luxury hotels are defined as five star properties as classified by the Dubai Department of Tourism and Commerce Marketing (DTCM). Similarly, other hotels comprise four, three, two, one star and listed hotels by DTCM classification.
The following table presents summary supply and demand indicators for Dubai hotels in 2006:
Table 4-1 |
|||
Category |
5-Star |
4-Star |
Overall Al DXB Hotels |
Supply Indicators |
|||
Operating Hotels |
40 |
40 |
302 |
Total Available Rooms |
11,806 |
5,990 |
30,850 |
Total Available Beds |
17,979 |
8,388 |
50,099 |
Demand Indicators |
|||
Room Occupancy Rate |
89.2% |
84.5% |
82% |
Bed Occupancy Rate |
88.6% |
84.2% |
77.3% |
ARR (AED) |
1,136 |
467 |
654 |
ARR(USD) |
311 |
128 |
179 |
RevPAR (AED) |
1,013 |
394 |
537 |
RevPAR (USD) |
278 |
108 |
147 |
Source: DTCM Statistics, 2006
In 2006 luxury hotels comprised 13% of Dubai hotel supply (40 hotels). At 17,796 available rooms, luxury hotel rooms comprised 58% of total available room’s inventory at all hotel in Dubai.
Similarly in 2006, luxury hotels provided 53% of all available beds in Dubai hotels at an average of 1.48 beds per room. Four star hotels provided marginally less beds per room than five star hotels (1.40 beds per room for four star hotels compared to 1.52 beds per room for 5 star hotels.
Average room rates (ARRs) at five star hotels in 2006 stood at AED 1,136 (USD 311) per room compared to AED 467 (USD 128) per room for four star hotels and AED 654 (USD 179) per room for the overall market. Five star hotels also enjoyed the highest occupancies (89.2%) out of all categories of hotels (market average 82% occupancy for all hotels). As such, RevPARs at five star properties averaged AED 1,013 (USD 278) per available room compared to AED 537 (USD 147) per available room for the market.
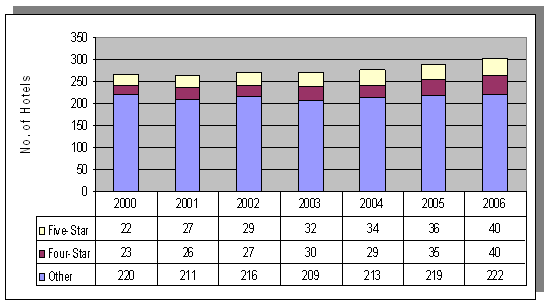
5.1 Luxury Hotel Supply Indicators (2000-2006)
The figure below represents the evolution of luxury hotel supply in Dubai between 2000-2006:
Figure 4-1 Luxury Hotel supply (2000-2006)
Source: DTCM Statistics, 2006
Overall hotel growth in Dubai from 265 hotels in year 2000 to 302 hotels in 2006 (14% growth was driven primarily by growth in luxury hotels. Luxury hotels grew 81.8% from 22 hotels in 2000 to 40 hotels in 2006 at a CAGR of 10.5% marginally out pacing four star hotel supply growth (73.9% growth at a CAGR of 9.7%).
5.2 Luxury Hotel Room Supply Indicators (2000-2006)
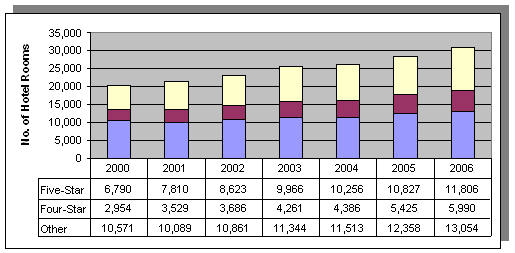
While luxury hotels comprised 13% of overall hotel supply in Dubai in year 2006, luxury hotels provided 38.3% of hotel room supply in the same year. Figure 4-2 presents the development of luxury hotel room supply in Dubai over the period 2000 – 2006.
Figure 4-2 Luxury Hotel Room Supply (2000-2006)
Source: DTCM Statistics, 2006
Overall, hotel room supply grew 51.9% from 20,315 rooms in 2000 to 30,850 rooms in 2006. Luxury hotel rooms grew 73.9% from 6,790 rooms in 2000 to 11,806 rooms in 2006. While four star hotel room grew faster than five star hotel rooms over the same period (CAGR of 12.5% for four star hotel rooms compared to CAGR of 9.7% for five star hotel rooms) five star hotel room supply at 11,806 rooms in year 2006 remains approximately double four star room supply.
5.3 Luxury Hotel Bed Supply Indicators (2000 – 2006)
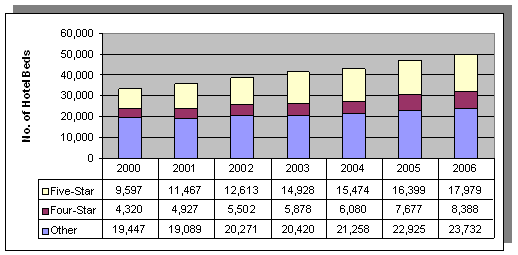
The figure below present’s luxury presents luxury hotel bed supply in Dubai over the period 2000 – 2006:
Figure 4-3 Luxury Hotel Bed Supply 2000-2006
Source: DTCM Statistics, 2006
Overall, hotel bed supply grew 50.2% from 33,364 beds in 2000 to 50,099 beds in 2006. Luxury hotel beds grew87.3% over the same period with luxury hotel beds increasing from 9,597 beds in 2000 to 17,979 beds in 2006. Four star hotel bed growth marginally outpaced five star hotel bed growth, increasing 94.2% from 4,320 beds in 2000 to 8,388 beds in 2006.
On average, there were 1.52 beds per five star hotel room in year 2006 compared to 1.40 beds per four star hotel room.
6.0 APPENDIX: COMPETITIVE SET PERFORMANCE
INDICATORS (2005)
The following graphs compare competitive set hotel performance in terms of occupancy and average room rate in the year 2005.
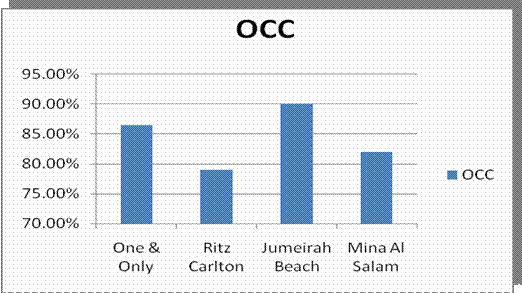
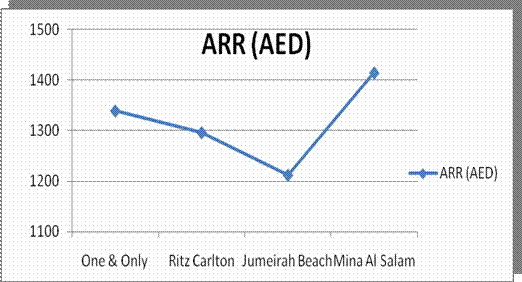
Source: Independent Research
Figure 5-2
Competitive Set-Select-Seasonality 2005
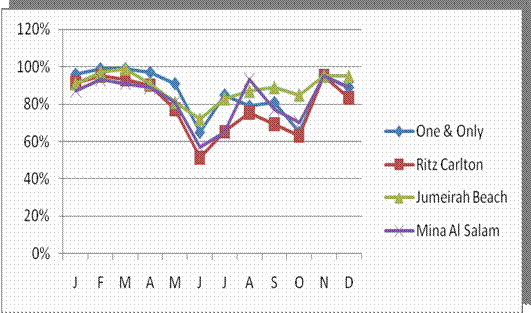
Sources: Independent Research
7.0 APPENDIX: ROOM FEATURES
7.1 Burj Al Arab
The all suite hotel offers the following categories of suites, starting from:
Deluxe Suite (1 Bedroom)
Panoramic Suites
Club suite (1 Bedroom)
Two Bedroom Suite
Three Bedroom Suite
Presidential Suite
For all suites at the Burj Al Arab:
Business Facilities
Entertainment Facilities
7.2 Jumeirah Beach Hotel
Jumeirah Beach Hotel offers the following rooms and suites.
Ocean Deluxe Room:
Ocean Club Executive Room:
Ocean Junior Suite:
One Bedroom Ocean Suite:
Two Bedroom Ocean Suite:
Beachcomber Suite:
Presidential Suite:
Royal Ocean Suite:
Complimentary services for the above types of suites include the following:
Bait Al Bahar:
Complimentary Services
For all suites within Jumeirah Beach Hotel:
Business Facilities
Entertainment Facilities
7.3 Madinat Jumeirah: Mina’ A Salam
Mina A’Salam provides the following rooms and suites:
Deluxe Balcony Room:
Club Executive / Premium Leisure Club Room
Ocean Suite
Arabian Gulf Suite:
Royal Suite:
Complimentary services include the following:
For all suites within Mina A’Salam
Business Facilities
Entertainment Facilities
7.4 Madinat Jumeirah: Al Qasr
Al Qasr offers the following and suite types:
Arabian Deluxe Room
Ocean Deluxe Room:
Club Executive / Premium Leisure Club Room:
Arabian Suite:
Junior Arabian Suite
Ocean Suite:
Junior Ocean Suite:
Presidential Suite:
Royal Suite:
Complimentary services:
For all Suites within Al Qasr:
Business Facilities Within Suite
Entertainment Facilities
7.5 Madinat Jumeirah: Dar Al Masyaf
Arabian Summer Houses, Approached through an enchanting, gardened central courtyard, the Arabian summer houses are entered through a large Arabic style door to reveal a space of sumptuous quality and stylish decorative themes. Arabian heritage is omnipresent in these exquisite properties, furnished in the warm tones and ochre hues redolent of times past.
Arabian Deluxe:
Arabian Suite:
Arabian Deluxe:
Arabian Suite:
Ocean Deluxe:
Ocean Suite:
Complimentary Services:
All suites within Dar Al Masyaf:
Business Facilities
Entertainment Facilities
7.6 The One and Only Royal Mirage
Rooms and suites within the ‘Palace’:
Deluxe Room:
Executive Suite:
Gold Club Room:
Gold Club Suite:
Royal Suite:
Rooms and suites within the ‘Arabian Court’:
Deluxe Room:
Executive Suite:
Prince Suite:
7.7 Ritz Calton
Deluxe Room:
Club Room:
Emirates Suites:
Executive Suite:
The Ritz Carlton Suite:
Aleesie, L. (October 2007). Things Get Personnel in Dubai. HVS International, London.
Clarke, C. (May 2007). Middle East Hotel Industry Leads the World in Performance. Article 4Hoteliers.
Colliers International. Dubai Real Estate Overview. Market Research, Fourth Quarter. Economic Highlights (2007)
Department of Tourism & Commerce Marketing – various reports and press releases, 2006 – 2007
Goddard, P (2006). Ready for 30 Million Room Nights? TRI Hospitality Consulting.
HVS International (2007). Middle East Hotel Survey – Outlook, Market Trends and Opportunities, London.
Industry Experts Expect Blue Skies Ahead for Regional and Global Hospitality Sectors, Arabian Hotel Investment Conference (AHIC, May 2007), ‘Global Aspirations’ Madinat Jumeirah Conference Centre. Dubai UAE.
Leeman, S. & Younes, E. (November 2005). HVS International, The Dubai Hotel Market – Hot or Soon To Overheat?
Hotelier Middle East, June 2007 – June 2008
Hotel Investment Sector is Soaring But Still Room for Growth, Arabian Hotel Investment Conference (AHIC, May 2008), ‘Global Aspirations’ Madinat Jumeirah Conference Centre. Dubai UAE.
Middle East Review – Comprehensive Real Estate & Investment Management Expertise. Strong Market Forces for UAE Hotels. Jones Lang LaSalle. Volume 7, 2007
Real Estate & Investment Middle East. 31 July 2007.
Steinmetz, T (21 May 2008). Dubai Bubble: About to Burst. Global Travel Industry News.
The Future of Travel and Tourism in the Middle East – a Vision to 2020 – Global Futures and Foresight Pathfinder Report May 1st 2007
Towering Vision Becomes Concrete Reality – The Hotel Show 2007 Catalogue and Industry Yearbook
Web Links
Red Sea Projects to Attract SR150 Billion – KSA http://www.menafn.com/qn_news_story_s.asp?StoryId=1093153388
Bawadi to double investment
http://archive.gulfnews.com/ar t icles/07/05/13/10124872.html
7-star hotel to be opened in Iran http://www.presstv.ir/detail.aspx?id=10759§ionid=351020108
Emaar to Construct 2 New Projects in Egypt
http://www.menafn.com/qn_news_story_s.asp?StoryId=1093150428
Movenpick to be part of a major tourism project in Oman
http://www.traveldailynews.com/new.asp?newid=37422&subcategory_id=59
Abu Dhabi unveils big eco-tourism project
http://archive.gulfnews.com/articles/07/04/30/10121879.html
Construction waste recycling plant set up
http://archive.gulfnews.com/ar t icles/07/05/23/10127168.html
Najwa finalises agreement ASEZA to develop Wadi Rum project. http://www.menafn.com/qn_news_story_s.asp?StoryId=1093151715
Fairmont goes green
http://www.arabianbusiness.com/index.php?option=com_content&view=article&id=12993
Masdar launches first zero-carbon city
http://www.tradearabia.com/news/newsdetails.asp?Sn=ENV&artid=123262
UNEP to monitor water usage in Arab cities
http://archive.gulfnews.com/ar t icles/07/05/24/10127404.html
Dubai hotels wasteful http://www.ameinfo.com/120642.html
Kuwait must spend $27bn on power
http://www.arabianbusiness.com/index.php?option=com_content&view=article&id=13386:Kuwait-must-spend-27bn-on-power&Itemid=1
Arabs need $345bn for energy http://www.ameinfo.com/121694.html