Jordão Manuença Luís
Title: Organizing Data
Area:
Country:
Program:
Available for Download: Yes
View More Student Publications Click here
For more information on the AIU's Open Access Initiative, click here.
Contents
1. Introduction
2. Questions and Answers
2.1. Question number 1
2.1.1. Answer number 1
2.2. Question number 2
2.2.1. Answer number 2
2.3. Question number 3
2.3.1. Answer number 3
2.4. Question number 4
2.4.1. Answer number 4
2.5. Question number 5
2.5.1. Answer number 5
2.6. Question number 6
2.6.1. Answer number 6
2.7. Question number 7
2.7.1. Answer number 7
2.8. Question number 8
2.8.1. Answer number 8
2.9. Question number 9
2.9.1. Answer number 9
2.10. Question number 10
2.10.1. Answer number 10
2.11. Question number 11
2.11.1. Answer number 11
3. Conclusion
4. Bibliography
1. Introduction
Organizing data has a huge importance all over the world, for macro application certainly referring to the prediction of the development of countries in terms of economics, social, academic, natural resources, health care and so on, including an international comparison in the field of games, political and human development indices. In micro application, the families get benefits in organizing data by many application as in the control of the domestic animals, in food control against number of family members even for the monetary control; Well the data application can be for infinitely application.
This organizing data assignment which contain eleven exam questions is going to be organized in such way that each every answer is going to preceded by it corresponding question for better understanding.
In this way this exam assignment highlight on concepts of variables, from which the data concept is based and can be distinguished from the quantitative one to the qualitative, a table of data that generate a frequency and a relative-frequency data observation table, which enable a different types of chat plot for the data illustration.
2. Questions and Answers
2.1. Question number 1
This problem is about variables and data.
a. What is a variable?
b. Identify two main types of variables.
c. Identify the two types of quantitative variables.
d. What are data?
e. How is data type determined?
2.1.1. Answer number 1
a) Variable is considered as a characteristic that can vary from one person, animal or thing to another.
b) The two main types of variables are: Qualitative variable and quantitative variable.
c) The two types of quantitative variables are: Discrete variable and continuous variable.
d) Data are values of a variable for one or more people, animal or things.
e) Data type is determined by collection, organization, and analyze of information by statisticians; and they can be classified as qualitative data and quantitative data, and this last by discrete data and continuous data.
2.2. Question number 2
For a qualitative data set, what is a
a. frequency distribution?
b. relative-frequency distribution?
2.2.1. Answer number 2
a) A frequency distribution of qualitative data set is a listing of the distinct values and their frequencies (that are values of the observations and how often they occur).
b) Relative-frequency distribution of qualitative data set is the ratio of the frequency to the total number of observations, (that is the decimal or the percentile part of each data in the data set).
2.3. Question number 3
Identify two main types of graphical displays that are used for qualitative data.
2.3.1. Answer number 3
Two main types of graphical displays that are used for qualitative data are pie charts and bar charts.
2.4. Question number 4
When is the use of single-value grouping particularly appropriate?
2.4.1. Answer number 4
The Single-value grouping method is particularly appropriate for discrete quantitative data in which there are only a small number of distinct values.
2.5. Question number 5
A quantitative data set has been grouped by using limit grouping with equal-width classes. The lower and upper limits of the first class are 3 and 8, respectively, and the class width is 6.
a. What is the class mark of the second class?
b. What are the lower and upper limits of the third class?
c. Which class would contain an observation of 23?
2.5.1. Answer number 5
a) The class mark of the second class is 11.5
c) The lower and upper limits of the third class are respectively 15 and 20.
d) The class that would contain an observation of 23 is the class of (21- 26)
2.6. Question number 6
A quantitative data set has been grouped by using cutpoint grouping with equal-width classes of width 8.
a. If the midpoint of the first class is 10, what are its lower and upper cutpoints?
b. What is the class midpoint of the second class?
c. What are the lower and upper cutpoints of the third class?
d. Which class would contain an observation of 22?
2.6.1. Answer number 6
a) If the midpoint of the first class is 10 and 8 is width classes, its lower and upper cutpoints are respectively 6 and 14.
b) The class midpoint of the second class is 18.
c) The lower and upper cutpoints of the third class are respectively 22 and 30.
d) The class that would contain an observation of 22 is a third class.
2.7. Question number 7
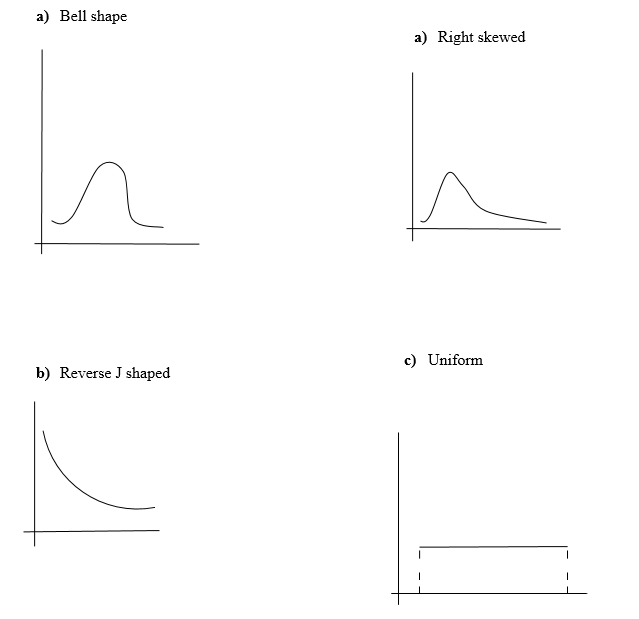
Sketch the curve corresponding to each of the following distribution shapes.
a. Bell shaped
b. Right skewed
c. Reverse J shaped
d. Uniform
2.7.1. Answer number 7
The curve corresponding to each of the following distribution shapes is:
 2.8. Question number 8
Largest Hydroelectric Plants. The world’s five largest hydroelectric plants, based on ultimate capacity, are as shown in the following table. Capacities are in megawatts. [SOURCE: T. W. Mermel, International Waterpower & Dam Construction Handbook]
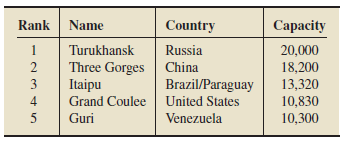 a. What type of data is given in the first column of the table?
b. What type of data is given in the fourth column?
c. What type of data is given in the third column?
2.8.1. Answer number 8
a) The type of data given in the first column of the table is ordinal data.
b) The type of data given in the fourth column of the table is continuous quantitative data.
c) The type of data given in the third column of the table is qualitative data.
2.9. Question number 9
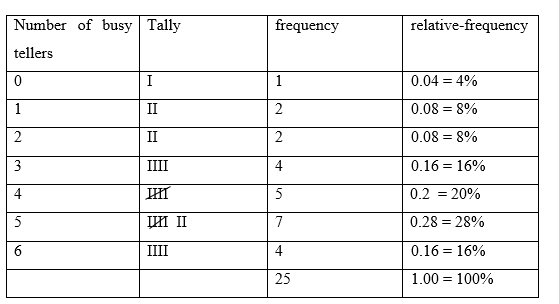
Busy Bank Tellers. The Prescott National Bank has six tellers available to serve customers. The data in the following table provide the number of busy tellers observed during 25 spot checks.
a. Use single-value grouping to organize these data into frequency and relative-frequency distributions.
b. Draw a relative-frequency histogram for the data based on the grouping in part (a).
c. Identify the overall shape of the distribution of these numbers of busy tellers.
d. State whether the distribution is (roughly) symmetric, right skewed, or left skewed.
e. Construct a dotplot for the data on the number of busy tellers.
f. Compare the dotplot that you obtained in part (e) to the relative-frequency histogram that you drew in part (b).
2.9.1. Answer number 9
a) Using a single-value grouping to organize these data into frequency and relative-frequency distributions, yields the following table:
 b) A relative-frequency histogram for the data based on the grouping in part (a) table is:
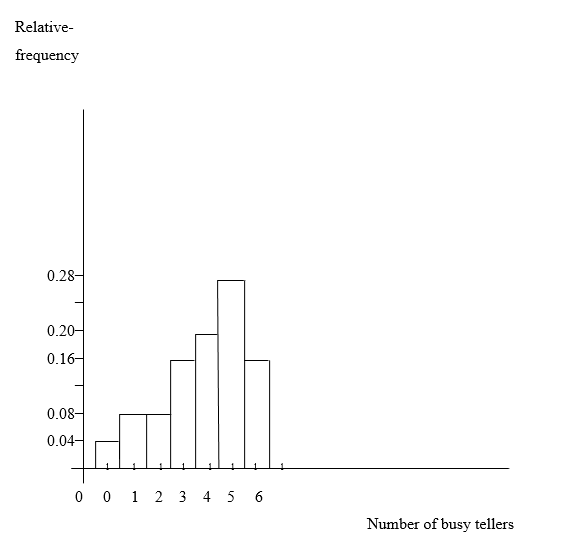
c) The overall shape of the distribution of these numbers of busy tellers is left skewed.
d) The distribution is (roughly) left skewed.
e) The following is a dotplot for the data on the number of busy tellers.
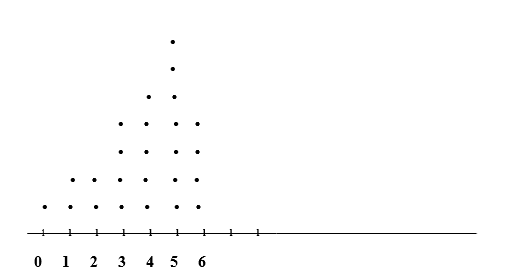 f) Comparing the dotplot that I obtained in part (e) to the relative-frequency histogram that I drew in part (b), I conclude that the dots position are in the same position as the bar position of the relative-frequency histogram chat.
2.10. Question number 10
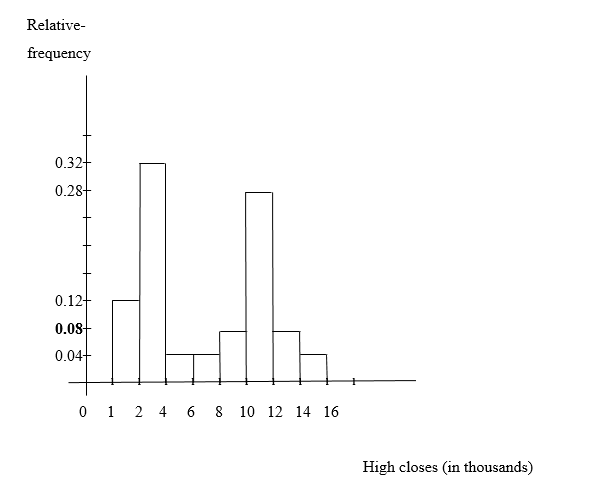
Dow Jones High Closes. From the document Dow Jones Industrial Average Historical Performance, published by Dow Jones & Company, we obtained the annual high closes for the Dow for the years 1984–2008.
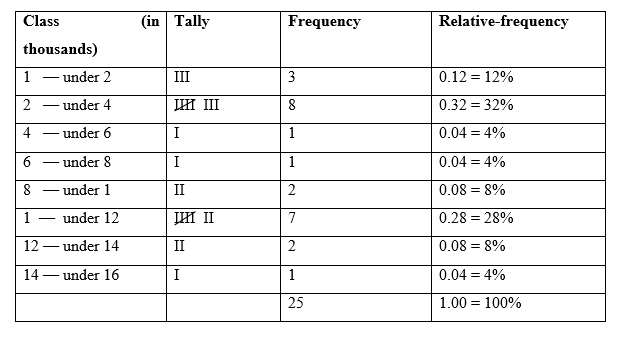
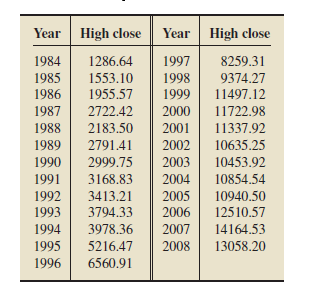 a. Construct frequency and relative-frequency distributions for the high closes, in thousands. Use cutpoint grouping with classes of equal width 2 and a first lower cutpoint of 1.
b. Draw a relative-frequency histogram for the high closes based on your result in part (a).
2.10.1. Answer number 10
a) The cutpoint grouping frequency and relative-frequency distributions for the high closes, with classes of equal width 2 and a first lower cutpoint of 1, in thousands is:
b) A relative-frequency histogram for the high closes based on my result in part (a) is:
2.11. Question number 11
CASE STUDY DISCUSSION
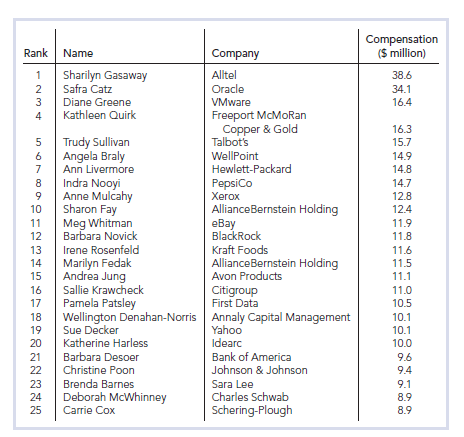
25 HIGHEST PAID WOMEN
Recall that, each year, Fortune Magazine presents rankings of America’s leading business women, including lists of the most powerful, highest paid, youngest, and “movers.” On page 35, we displayed a table showing Fortune’s list of the25 highest paid women.
List from page 35 of the25 highest paid women
a. For each of the four columns of the table, classify the data as either qualitative or quantitative; if quantitative, further classify it as discrete or continuous. Also identify the variable under consideration in each case.
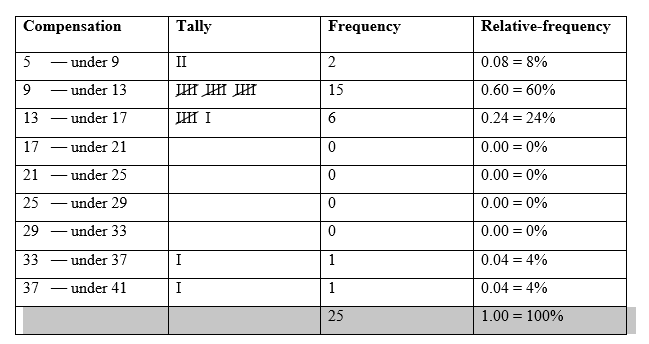
b. Use cutpoint grouping to organize the compensation data into frequency and relative-frequency distributions. Use a class width of 5 and a first cutpoint of 5.
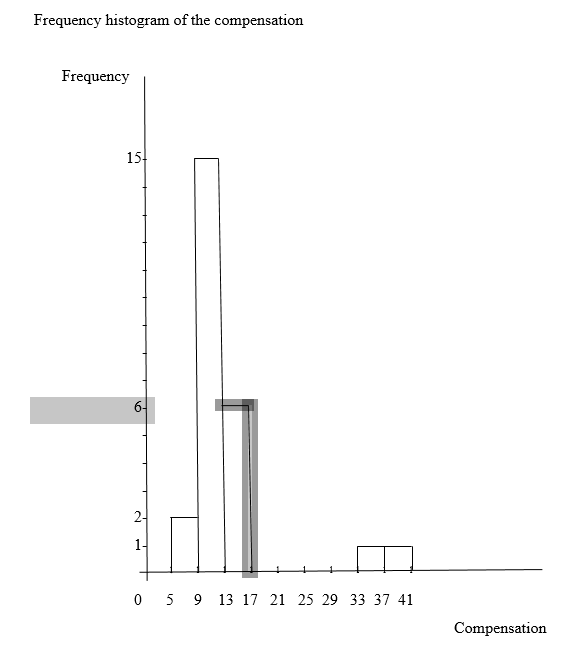
c. Construct frequency and relative-frequency histograms of the compensation data based on your grouping in part (b).
d. Identify and interpret the shape of your histograms in part (c).
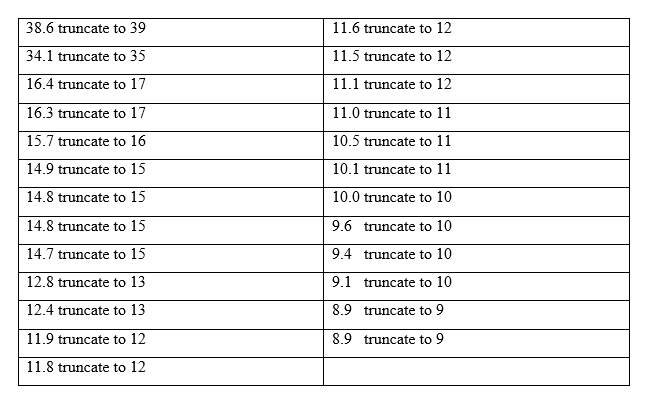
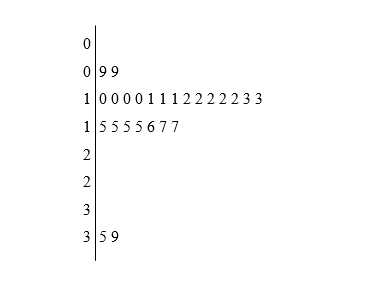
e. Truncate each compensation to a whole number (i.e., find the greatest integer in each compensation), and then obtain a stem-and-leaf diagram of the resulting data, using two lines per stem.
f. Round each compensation to a whole number, and then obtain a stem-and-leaf diagram of the resulting data, using two lines per stem.
g. Which of the stem-and-leaf diagrams in parts (e) and (f) corresponds to the frequency histogram in part (c)? Can you explain why?
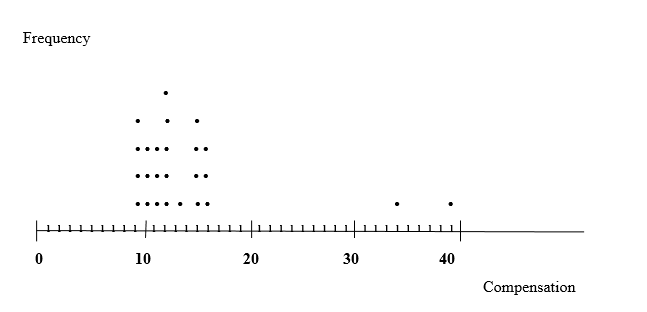
h. Round each compensation to a whole number, and then obtain a dotplot of the resulting data.
2.11.1. Answer number 11
a) For the four columns of the table data classification as either qualitative or quantitative; and further classification as discrete or continuous if they are quantitative is:
First column is a quantitative ordinary data
Second column is qualitative data
Third column is qualitative data
Fourth column is discrete quantitative data.
The variable under consideration in each case is:
The first column contain ordinary quantitative variable;
The second column contain qualitative variable;
The third column contain qualitative variable;
The fourth column contain discrete quantitative variable
b) The cutpoint grouping frequency and relative-frequency distributions of the compensation data; with class width of 5 and a first cutpoint of 5 is:
c) The followings are frequency and relative-frequency histograms of the compensation data based on my grouping in part (b):
Frequency histogram of the compensation
Relative-frequency histogram of the compensation
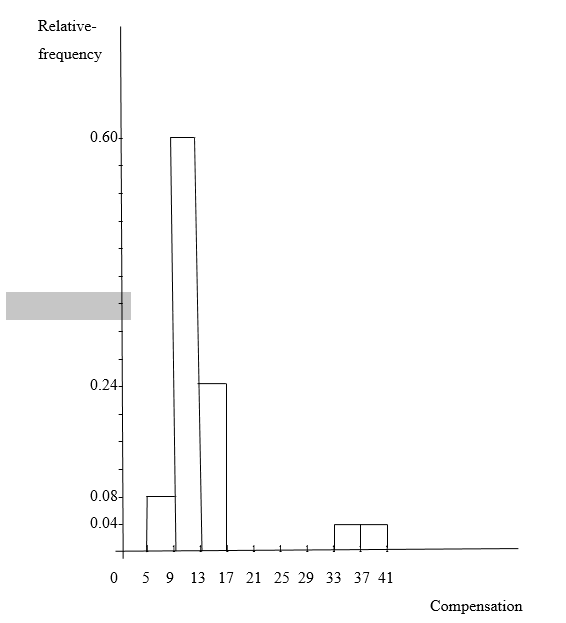
d) The shape of my histograms in part (c) is right skewed, because it is skewed to right hand side
e) The following is a table data and a two lines stem-and-leaf diagram of the resulting data from each truncate compensation to a whole number (that is the greatest integer in each compensation):
Table of each truncate compensation to a greatest whole number
Two lines stem-and-leaf diagram of each truncate compensation to a greatest whole number
f) The following is a table data and a two lines stem-and-leaf diagram of the resulting data from each rounded compensation to whole number:
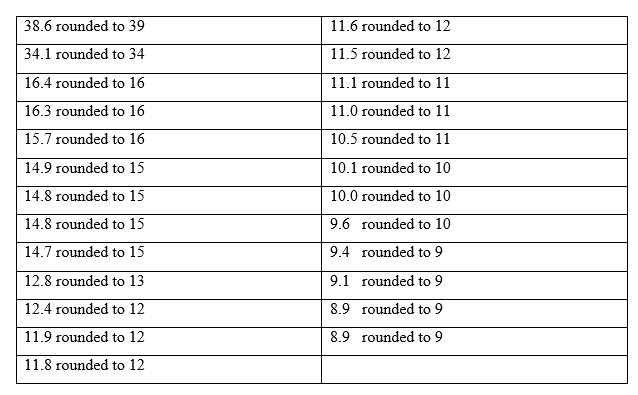
Two lines stem-and-leaf diagram of each rounded compensation to whole number
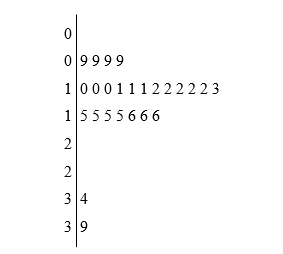
g) The part (f) stem-and-leaf diagram is the one that corresponds to the frequency histogram in part (c), because it has 5 leaves corresponding to the histogram with 5 bars.
h) The following is a dotplot obtained from the resulting data of each rounded compensation to a whole number:
3. Conclusion
Concluding, as in the introductory part, I have mentioned the huge importance of a data organization, this assignment brought a considerable outcome in terms of a deep knowledge of the statistics concepts on which is better to remind that without variable (the person, animal or thing variable characteristic from each to another), should be impossible to talk about different data that are: Qualitative data which is the uncountable data ( are qualifying character like colour of skin or eyes, blood kind, short or long), quantitative data which can be discrete data (the simple countable or ordinary ranking count) and continuous data (measurable data that can be width, height, temperature).
In this terms, known these classified data and because sometimes the same data appear many times in the same occasion, so it becomes important to organize data grouping in a table for frequency distribution and, or, in relative-frequency distribution that is the decimal part or a percentile part corresponding to each data for that occasion or an event. The grouping can be a single-value grouping, limit grouping and cutpoint grouping.
Finally, further more the illustration in graphs becomes a visual importance so that the picture drawn in the chat speaks itself on the data behaviour and shows a certain distribution shape which shows the tendency of that data. Referring to chat, there are different types of charts such as Pie chart, the bar chart used in histogram plot, the dotplot chart, a steam-leaf- diagram and probably so much as the statisticians continue to invent ways to display data.
4. Bibliography
Weiss, N. A, (2012), Elementary Statistics.8th edition, Pearson Education, Boston.
GREAT EDUCATORS HAVE ALWAYS KNOWN THAT LEARNING IS NOT SOMETHING THAT'S LIMITED TO THE CLASSROOMS, OR THAT SHOULD BE FORCIBLY UNDERTAKEN UNDER THE SUPERVISION OF TEACHERS.
BILL GATES

"BEING DOES NOT MEAN ACCEPTING WHAT ONE IS; IT MEANS CREATING ANOTHER SELF THAT DOES NOT EXIST."
J. CHATEAU